
Each year British Swimming undertakes an analysis of the performance data from the British Summer Championships. This analysis is intended to unearth themes and trends that are starting to emerge.
Why:
The ‘Most Improved Club’ Award was created to recognise that the importance that British Swimming puts on performing Season Best times at athletes benchmark meet. The aim was to move away from an award that recognised the volume of performances, to one that identifies clubs that are getting the process of progression right.
How:
The award is based on all athlete performances in Olympic events and taking their fastest time if they have swam in both rounds. A percentage is calculated from this time based on the progression or regression the athlete has shown in that event from their performances in the qualifying window. An average of these percentages is then calculated for each club to create overall progression or regression value.
As the British Summer Championships will be the key benchmark meet for the majority of athletes, all athletes events are included – it is up to the coach & athlete to decide which are the athletes key events to compete in to maximise performance.
Only clubs with 5 athletes competing at the meet are included in the award, as the results could be skewed by a single athlete in clubs with fewer competitors than this.
One of the most important metrics we look at relates to the ability of our club swimmers to perform at their best at this key end of season meet; we know that the capacity to perform a Season’s Best swim when it most matters is a key determinant in preparing athletes for the rigours of senior international swimming, and then being successful when they make this transition. Looking back to the tribulations of London 2012, if British swimmers had repeated their Olympic Trials performances at the Games, this would have resulted in a much bigger medal haul. Data taken from our British Senior Team at the key benchmark meets from 2013 – 2016 shows that the improvement in this metric has been a key determinant in our recent improvements in medal outcomes:

To translate this into the context of our domestic competition structure, we take a close look at the performance of all swimmers during the designated Qualifying Window (the point at which they qualify for the Summer meets), and then compare this with how they then perform at the British Summer Championships to see if their time has improved, stayed the same, or regressed. Much of this paper focus' on an analysis of this information.
To provide a direct comparison between our club programmes and the Great Britain Senior Team (as we look at detailed data for every swim and not just the percentage of swimmers in a team hitting a Season Best), in 2016 we saw:-
- For the Rio British Olympic Swim Team, an overall 0.10% improvement across all individual events swum, which rose to 0.27% improvement if the analysis focused solely on those swimmers who were part of British Swimming’s World Class Programme.
- As a relevant international benchmark, Team USA recorded an overall 0.20% improvement
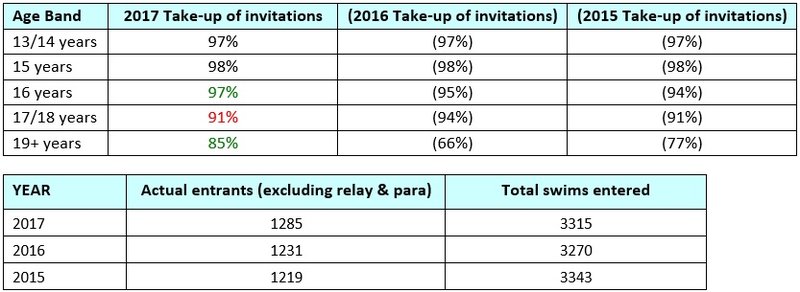
Take up of invitations at the British Summer Championships
Club Performance
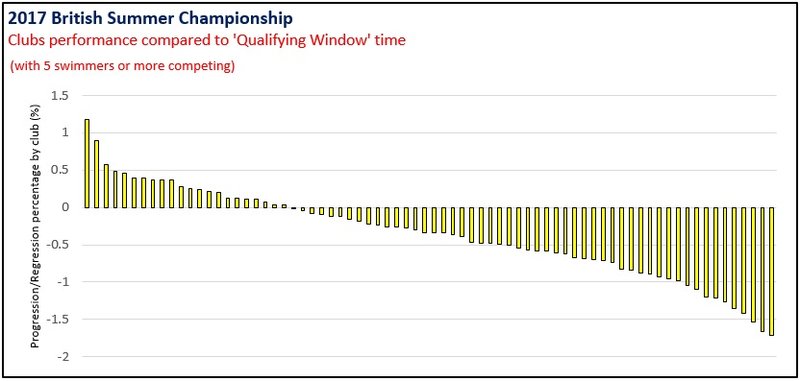
There were 74 clubs who had 5 or more swimmers compete at the meet
22 Clubs (30%) were able to produce an overall progression of their athlete's times when compared to the Qualifying Window
The remaining 52 clubs (70%) saw a general regression in the performance of their athletes when compared to the Qualifying Window
The best performing club improved on average 1.18% across every swimmer in event individual Olympic event, whilst the worst performing club had an average progression of 1.71%
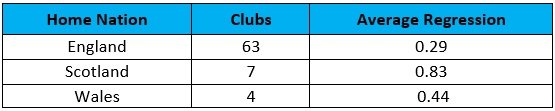
Data across the Home Nations showed little variance, though Scotland demonstrated the most regression followed by Wales and then England
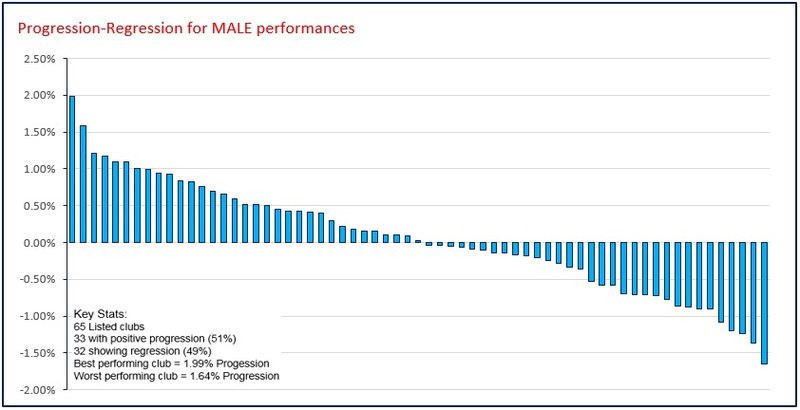
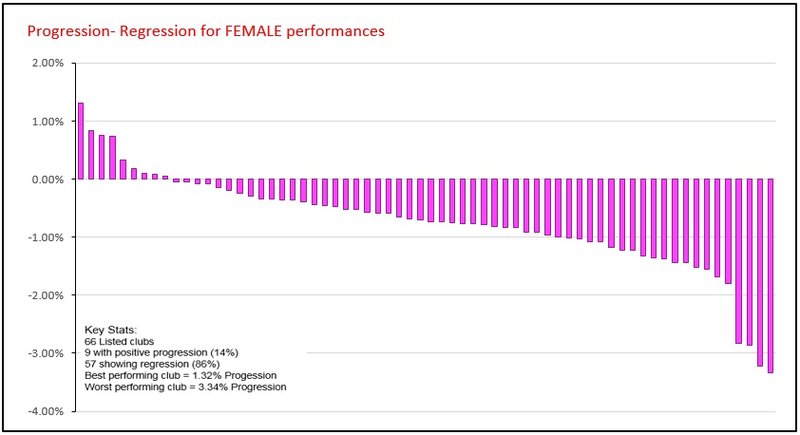
Male & Female Statistics
We then
looked at all clubs who had 3 or more swimmers compete at the event within a
single gender, and mapped out a similar graph of their progression–regression
statistics.
- There were many clubs who appeared on the graphs for one gender only.
- The number of clubs listed was similar in both cases - 65 male clubs versus 65 female.
- However, that is where the similarities ended:-
a.) 51% of male clubs managed a positive progression against only 14% of females clubs
b.) 86% of female clubs regressed against only 49% of male clubs
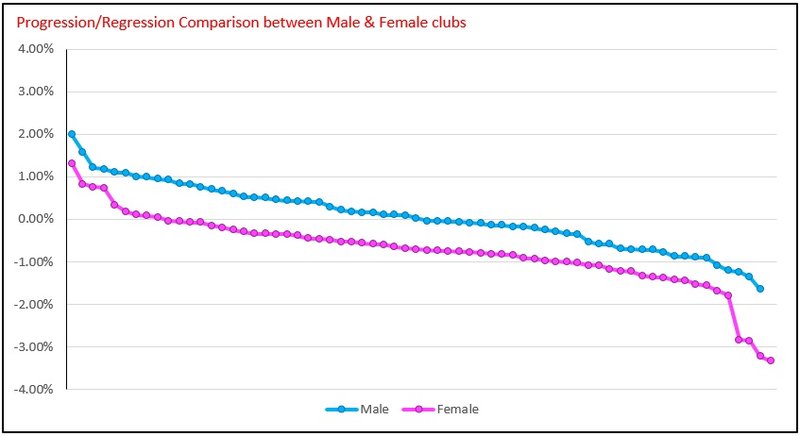
c.) The best performing male club produced an overall imporvement of 1.99%, against a progression of 1.32% for the best performing female club
d.) The worst performing female club saw a 3.34% regression, against 1.64% for the worst performing male club.
- There were some clubs who were very strong in the male area, but significantly weaker with their females.
- Conversely, there were very limited examples of clubs who had stronger female than male results listed; out of 42 clubs which had 3 or more athletes compete from both genders, only 5 achieved a high percentage for female improvements for their females than males.
- Only 2 clubs were in strong positive progression territory on both lists.
We then graphed the female clubs ranked 1-65 alongside the male clubs ranked 1-62, on average each male club performed over 0.5 better than their similarly ranked female club:-
Event Progression - Regression data
Once again, we have seen some disturbing trends when looking at event and gender data.
- When viewed
as a whole in CHART A, there were no Olympic events that saw performances at
the British Summer Championships improve from the Qualifying Window – except
for the Male 1500 Free
- When
separated by gender:-
a) EVERY SINGLE female event regressed compared to the Qualifying Window, by an average of -0.66%
b) 10 out of 13 (77%) of male events progressed from the Qualifying Window, by an average of 0.08%
c) Both genders saw their performances steadily fall away from Day 1 to Day 6, although this was not wholly linear (CHART B). Males managed positive overall progression on 4 of the 6 days, whilst the females were regressing right from Day 1. There are clearly wider lessons to be learnt here for all of our teams racing internationally across the globe.
Female Breaststroke was the worst performing stroke, whilst the Male 400m Freestyle the best performing event.Chart A
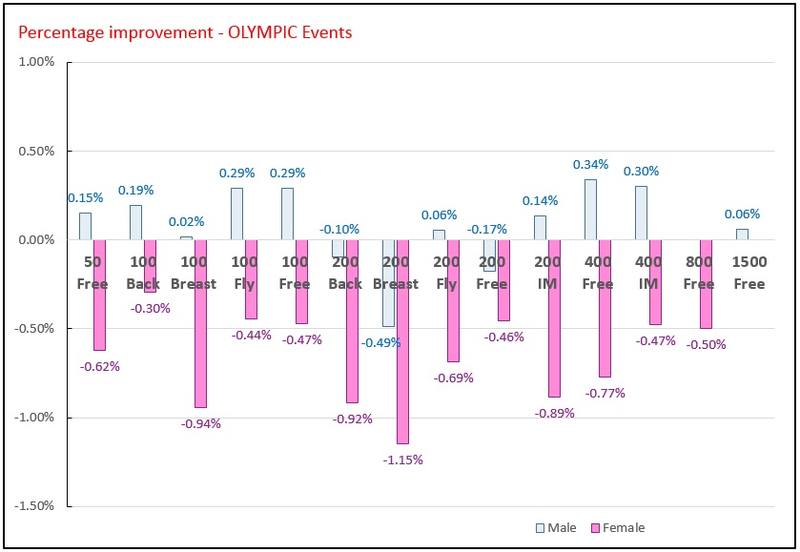
Chart B
When looking at the overall data from three years, there are some worrying trends, in particular the overall progression/regression rate has fallen in both 2016 and then again 2017.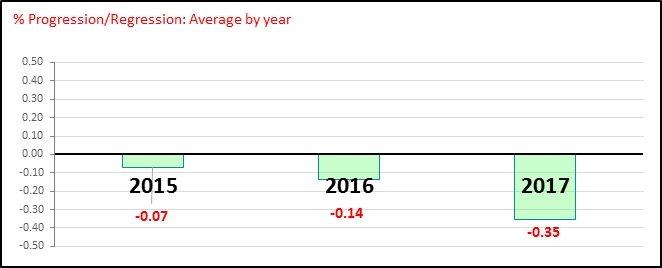
There are 53 clubs who have qualified 5 or more swimmers in each of 3 years since we have been collecting data (2015, 2016, 2017).
Of those 53 clubs only 6 (11%) have achieved positive progression in every year. These are: Basildon Phoenix, City of Birmingham, City of Newport, City of Sheffield, Millfield and Thanet.
Conversely 12 (23%) of these 53 clubs have regressed in each of the past three years, not registering a positive progression in any of the past three British Summer Championships.
The largest group from the 53 clubs are those that have achieved one year of positive progression and two years of regression, which equates to 21 clubs (40%).
There are 24 clubs that have qualified 5 or more swimmers in only one of the past 3 years:
16 of these 24 clubs (67%) regressed in their single appearance at British Summer Championships so far.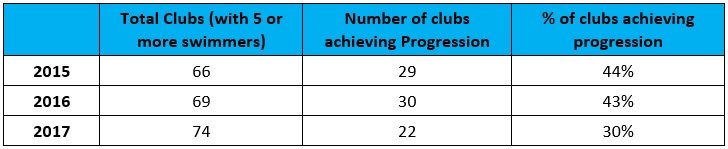
Comparison with GB International Junior Teams
In pulling together an appropriate comparison with GB international junior teams, we have also looked at the progression-regression statistics from the World Junior Championships, European Junior Championships, and European Youth Olympic Festival (EYOF) based on the times each athlete recorded to qualify for the meet from the April British Championships. In the few instances where an athlete didn’t swim a particular event at the qualifying meet (second or third swims in addition to their main event) then we used their Season’s Best performance prior to the British Championships.
The headline summary is as follows:-
- If the World Juniors team was considered as a ‘club’, then they would have achieved an overall progression of 0.19%. The European Juniors team saw an overall progression of 0.05% and the EYOF team a regression of -0.33%.
- If we then compared this to the club data from British Summer Championships, then our international teams would have finished in the following ranking positions:
16th - World Juniors
22nd - European Juniors
39th - EYOF
- There were 58 individual swims from our team at the World Juniors in Indianapolis of which 32 (55%) were a progression from their qualifying performance, another 24 (41%) showing regression, and 2 (4%) with neutral results.
- There were 105 individual swims from our team at the European Juniors in Netanya of which 50 (48%) were a progression from their qualifying performance, another 50 (48%) showing regression, and 5 (4%) with neutral results.
- There were 48 individual swims from our team at EYOF in Gyor of which only 20 (42%) achieved a progression from their qualifying performance, with another 26 (54%) showing regression and 2 (4%) with neutral results.
- If split by gender, the best performing male group was within the EYOF team (0.48% overall progression), and best performing female group was World Juniors team (0.39% overall progression).
- The only positive progression recorded by a female group was at the World Juniors, after a regression of -1.22% at EYOF and -0.07% at European Juniors, giving an overall -0.30% regression from the female groups across all three competitions.
- Conversely the male groups achieved overall progressions at EYOF (0.48%) and the European Juniors (0.16%), whilst recording a very small regression of -0.01% at World Juniors. This resulted in an overall progression of 0.21% from the male groups across all three competitions.
Summary
There were some worrying trends noted when we first did an analysis of the data and trends coming out of the 2015 British Summer Championships. Further in-depth analysis over the past two years shows that we have regressed even further.
Whilst the number of clubs with 5 or more swimmers competing at the British Summer Championships is on a gentle rise, the percentage of these clubs now able to produce a positive progression in their athletes from the Qualifying Window to the British Summer Championships is at an all-time low of 30%.
Most clubs struggle to produce progressions within their female athlete group, and across the board, for the second year running, we have seen ALL female events regress as a whole from the Qualifying Window. We all need to question our approach and coach education around female performance, as there is very clearly something going very wrong.
And looking back to 2015, only 6 clubs have managed a progression in each of the 3 years the British Summer Championships has been running.
We have some very real challenges. We know that our swimmers representing Great Britain at the summer international meets have to possess the ability to swim at their best at these key benchmark meets. If our clubs are not producing athletes with the capability of doing this, we are always going to be swimming against the tide to be a successful international swimming nation.
The comparison shown with our GB junior international teams broadly shows that the trends by gender are unsurprisingly very similar, although we clearly do have some individual athletes who have the ability to perform when it matters (evidenced by all of our medals at the World Juniors coming from female athletes).
We all need to examine this information now to further comprehend some of these underlying themes and in particular why our athletes, (and in particular our female athletes) struggle to replicate performances from the Qualifying Window at their benchmark meet to better understand what needs to change at talent level to reverse this trend in the future.
There is of course a wider responsibility on us all to work together to address these significant performance challenges.